Energy
Animation: U.S. Electric Vehicle Sales (2010-19)
It’s challenging to get ahead, but it’s even harder to stay ahead.
For companies looking to create a sustainable competitive advantage in a fast-moving, capital intensive, and nascent sector like manufacturing electric vehicles, this is a simple reality that must be accounted for.
Every milestone achieved is met with the onset of new and more sophisticated competitors – and as the industry grows, the stakes grow higher and the market gets further de-risked. Then, the real 800-lb gorillas start to climb their way in, making competition even more fierce.
Visualizing U.S. EV Sales
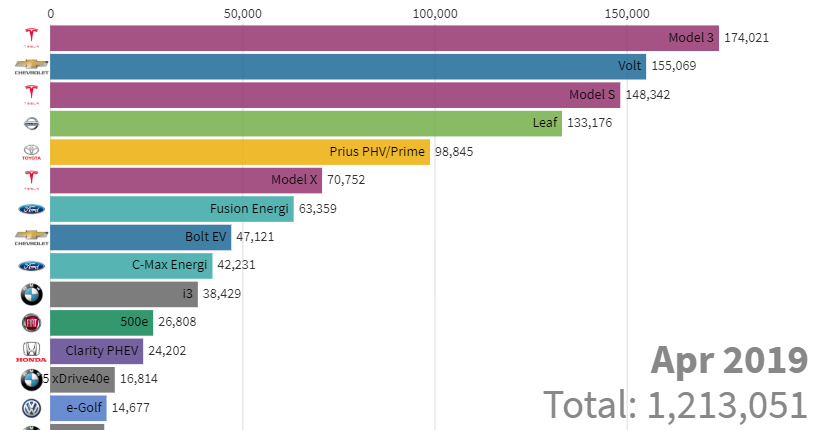
Today’s animation uses data from InsideEVs to show almost nine years of U.S. sales in the electric vehicle market, sorted by model of car.
It paints a picture of a rapidly evolving market with many new competitors sweeping in to try and claim a stake. You can see the leads of early successes eroded away, the increasing value of scale, and consumer preferences, all rolled into one nifty animation.
Animation currently unavailable
The Tesla Roadster starts with a very early lead, but is soon replaced by the Nissan Leaf and Chevrolet Volt, which are the most sold models in the U.S. from 2011-2016.
Closer to the end, the Tesla Model S rises fast to eventually surpass the Leaf by the end of 2017. Finally, the scale of the rollout of the Tesla Model 3 is put into real perspective, as it quickly jumps past all other models in the span of roughly one year.
The Gorilla Search
While Tesla’s rise has been well-documented, it’s also unclear how long the company can maintain an EV leadership position in the North American market.
As carmakers double-down on EVs as their future foundations, many well-capitalized competitors are entering the fray with serious and ambitious plans to make a dent in the market.
In the previous animation, you can already see there are multiple models from BMW, Volkswagen, Honda, Fiat, Ford, Toyota, Nissan, and Chevrolet that have accumulated over 10,000 sales – and as these manufacturers continue to pour capital in the sector, they are likely posturing to try and find how to create the next mass market EV.
Of these, Volkswagen seems to be the most bullish on a global transition to EVs, and the company is expecting to have 50 fully electric models by 2025 while investing $40 billion into new EV technologies (such as batteries) along the way.
The Chinese Bigfoot?
However, the 800-lb gorilla could come from the other side of the Pacific as well.
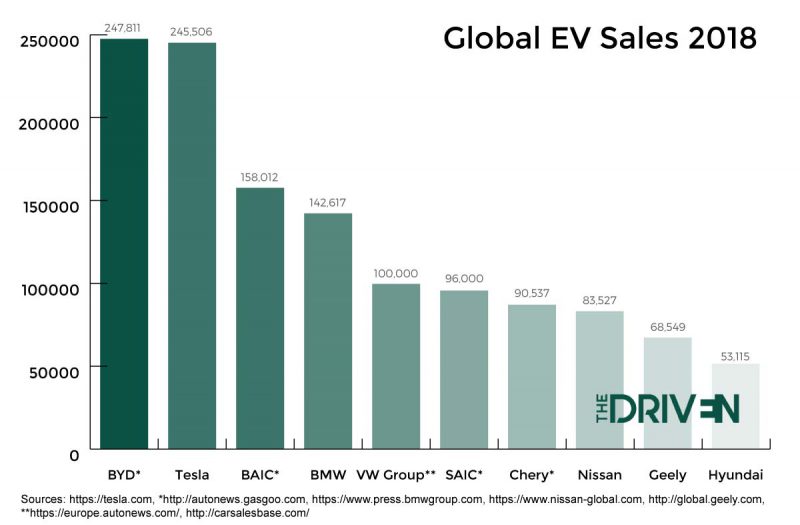
Source: The Driven
Chinese company BYD – which is backed by Warren Buffett – is currently the largest EV manufacturer in the world, selling 250,000 EVs in 2018.
The Chinese carmaker quietly manufacturers buses in the U.S. already, and it has also announced future plans to sell its cars in the U.S. as well.
How will such an animation of cumulative U.S. EV sales look in the future? In such a rapidly evolving space, it seems it could go any which way.


Energy
The World’s Biggest Nuclear Energy Producers
China has grown its nuclear capacity over the last decade, now ranking second on the list of top nuclear energy producers.


The World’s Biggest Nuclear Energy Producers
This was originally posted on our Voronoi app. Download the app for free on Apple or Android and discover incredible data-driven charts from a variety of trusted sources.
Scientists in South Korea recently broke a record in a nuclear fusion experiment. For 48 seconds, they sustained a temperature seven times that of the sun’s core.
But generating commercially viable energy from nuclear fusion still remains more science fiction than reality. Meanwhile, its more reliable sibling, nuclear fission, has been powering our world for many decades.
In this graphic, we visualized the top producers of nuclear energy by their share of the global total, measured in terawatt hours (TWh). Data for this was sourced from the Nuclear Energy Institute, last updated in August 2022.
Which Country Generates the Most Nuclear Energy?
Nuclear energy production in the U.S. is more than twice the amount produced by China (ranked second) and France (ranked third) put together. In total, the U.S. accounts for nearly 30% of global nuclear energy output.
However, nuclear power only accounts for one-fifth of America’s electricity supply. This is in contrast to France, which generates 60% of its electricity from nuclear plants.
| Rank | Country | Nuclear Energy Produced (TWh) | % of Total |
|---|---|---|---|
| 1 | 🇺🇸 U.S. | 772 | 29% |
| 2 | 🇨🇳 China | 383 | 14% |
| 3 | 🇫🇷 France | 363 | 14% |
| 4 | 🇷🇺 Russia | 208 | 8% |
| 5 | 🇰🇷 South Korea | 150 | 6% |
| 6 | 🇨🇦 Canada | 87 | 3% |
| 7 | 🇺🇦 Ukraine | 81 | 3% |
| 8 | 🇩🇪 Germany | 65 | 2% |
| 9 | 🇯🇵 Japan | 61 | 2% |
| 10 | 🇪🇸 Spain | 54 | 2% |
| 11 | 🇸🇪 Sweden | 51 | 2% |
| 12 | 🇧🇪 Belgium | 48 | 2% |
| 13 | 🇬🇧 UK | 42 | 2% |
| 14 | 🇮🇳 India | 40 | 2% |
| 15 | 🇨🇿 Czech Republic | 29 | 1% |
| N/A | 🌐 Other | 219 | 8% |
| N/A | 🌍 Total | 2,653 | 100% |
Another highlight is how China has rapidly grown its nuclear energy capabilities in the last decade. Between 2016 and 2021, for example, it increased its share of global nuclear energy output from less than 10% to more than 14%, overtaking France for second place.
On the opposite end, the UK’s share has slipped to 2% over the same time period.
Meanwhile, Ukraine has heavily relied on nuclear energy to power its grid. In March 2022, it lost access to its key Zaporizhzhia Nuclear Power Station after Russian forces wrested control of the facility. With six 1,000 MW reactors, the plant is one of the largest in Europe. It is currently not producing any power, and has been the site of recent drone attacks.

-

 Green2 weeks ago
Ranked: Top Countries by Total Forest Loss Since 2001
-

 Travel1 week ago
Ranked: The World’s Top Flight Routes, by Revenue
-

 Technology2 weeks ago
Ranked: Semiconductor Companies by Industry Revenue Share
-

 Money2 weeks ago
Which States Have the Highest Minimum Wage in America?
-

 Real Estate2 weeks ago
Ranked: The Most Valuable Housing Markets in America
-

 Markets2 weeks ago
Charted: Big Four Market Share by S&P 500 Audits
-

 AI2 weeks ago
The Stock Performance of U.S. Chipmakers So Far in 2024
-

 Automotive2 weeks ago
Almost Every EV Stock is Down After Q1 2024